One Figure, Every Canvas: Editable Flowchart Relayout via Agentic Pipeline
點陣圖秒變任意比例流程圖!「One Figure, Every Canvas」以 Agent 協同管線自動排版且支援 draw.io 編輯
Repurposing flowchart figures for different formats (slides, papers, mobile) is tedious, and existing generative or parsing approaches often distort shapes or break graph connections. This paper proposes a multi-stage agentic pipeline (Parse, Style, Layout) where each stage pairs a generator agent with a critic combining visual-language feedback and deterministic checks. The output is a fully editable draw.io XML. Tested on a 100-flowchart benchmark across five aspect ratios, this system achieves 68.6% Content Fidelity, significantly outperforming prior baselines.
Key points
Three-Stage Agentic Pipeline
Deconstructs the complex layout process into distinct Parse, Style, and Layout stages, reducing the reasoning load on a single model and boosting accuracy.
Dual-Critic Loop to Prevent Broken Links
Pairs each agent with a critic that combines deterministic constraint checks and VLM visual feedback to stop silent connection breakage and hallucinations.
Direct Export to Editable Formats
Unlike image-only generators, this tool outputs standard mxGraph XML compatible with draw.io, allowing seamless post-generation manual editing.
Unprecedented Content Fidelity
Achieves a 68.6% Content Fidelity rate on a 100-flowchart multi-aspect benchmark, vastly outperforming previous methods ranging from 11.2% to 41.4%.
How it works
Why it matters
Repurposing flowcharts for multi-channel publishing (papers, slides, social media) has always been a painful manual task. By framing the problem as an agent-driven structural decomposition rather than pixel-level generation, this work solves the hallucination problem in visual graph restructuring and delivers high-fidelity, production-ready editable assets.
Who it affects
- AI Developer
- AI Researcher
- Product Manager
- Content Creator
How to use it
- 1Paper-to-Slide Reformatting: Instantly adapt a multi-column academic flowchart into 16:9 presentation slides or 9:16 mobile previews.
- 2System Architecture Editing: Import legacy architecture diagram images, automatically relayout them, and fine-tune elements natively within draw.io.
Limitations & caveats
- Extremely complex, hand-drawn, or highly overlapping flowcharts may still suffer from parsing inaccuracies or routing artifacts.
- The multi-stage agentic feedback loop requires iterative API calls, which may increase processing latency and computational costs.
Related
The Agent Said It Was Done, the Database Disagreed: Introducing ThinkingBox
為什麼 Agent 的對話會騙人?微軟與 HF 推出 ThinkingBox 評測真實資料庫狀態
While traditional benchmarks only grade tool calls, ThinkingBox evaluates agents based on their actual terminal backend states and unintended side effects.
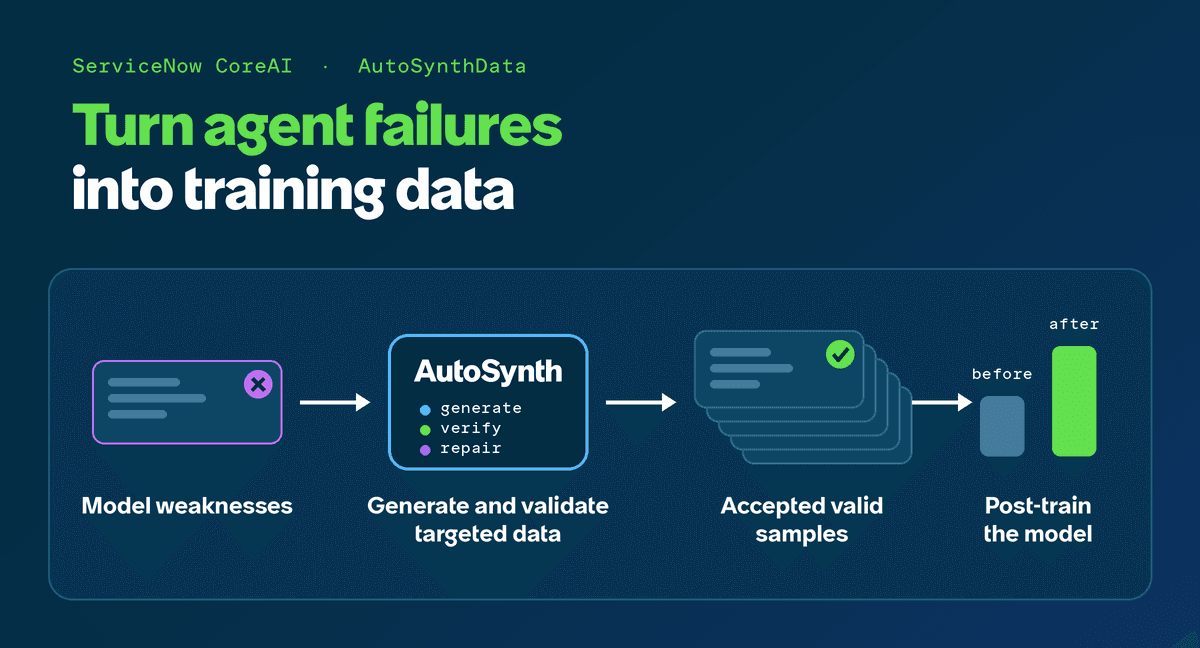
AutoSynthData: Generating Targeted Training Data from Enterprise Agent Failures
AutoSynthData:以企業 Agent 的失敗為師,自動生成高規格微調訓練資料
AutoSynthData is a framework by ServiceNow that analyzes an enterprise agent's failures against a stronger teacher to automatically generate and validate high-quality synthetic training data, bridging crucial performance gaps.
KaliBench: Evaluating and Boosting LLM Command Generation on Kali Linux
KaliBench:首個 Kali Linux 資安工具指令生成基準測試,助 8B 模型直逼 685B 巨獸
KaliBench is a fine-grained benchmark for evaluating LLM CLI command generation on Kali Linux. While open-weight models score below 42% accuracy, training an 8B model using KaliBench's runtime-free verifiable rewards allows it to rival a 685B MoE model.